New computer Pictures/Specs/Info
Specs
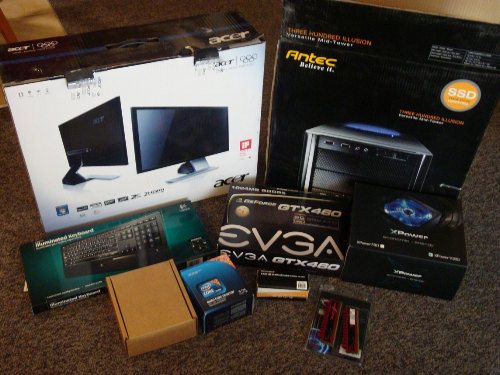
- Intel Core i5-760 Lynnfield 2.8GHz LGA 1156 95W Quad-Core Desktop Processor (Overclocked to 3.4GHz)
- EVGA GeForce GTX 460 (Fermi) Superclocked 1GB (Overclocked to Core:844 MHz; Shader:1688MHz; Memory:1938Mhz
- G.SKILL Ripjaws Series 4GB (2 x 2GB) DDR3 1600 (PC3 12800)
- Acer S243HLbmii Black 24" Full HD LED Backlight LCD Monitor
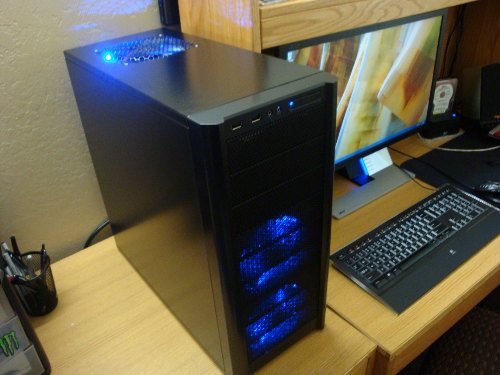
- Antec Three Hundred ATX Mid Tower Computer Case
- hec XP1080 1080W Continuous Power Supply
- MSI P55A-GD55 LGA 1156 Intel SATA 6Gb/s USB 3.0 ATX Intel Motherboard
- SAMSUNG HD502HJ 500GB 7200 RPM 16MB Cache SATA 3.0Gb/s 3.5" Internal Hard Drive
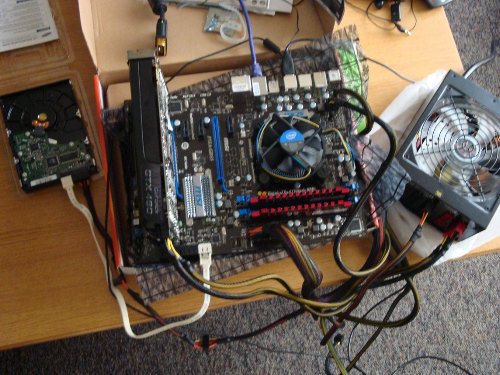
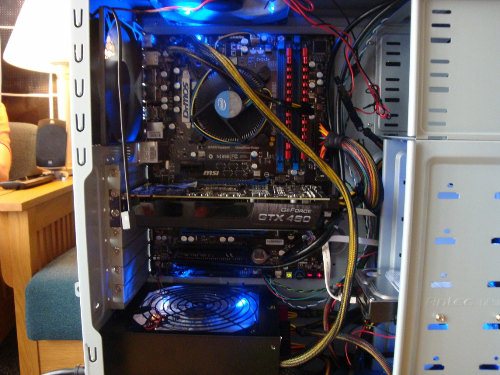
Build Pictures
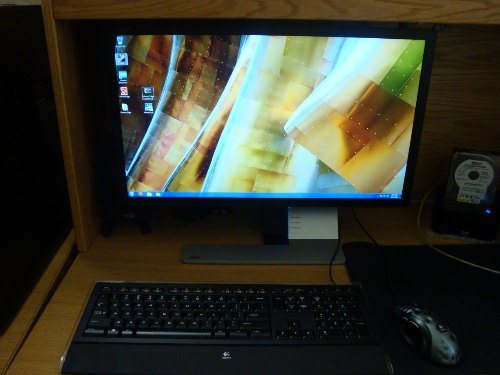
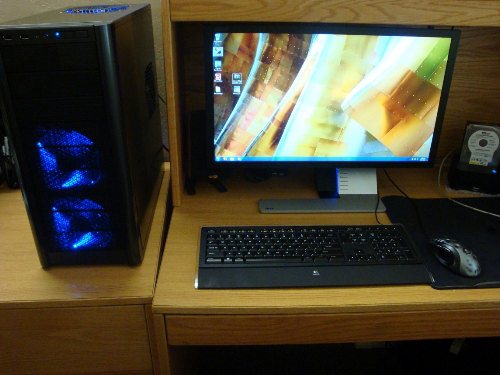
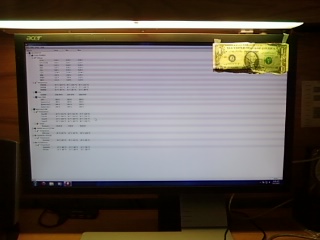
Showing monitor size against common items
Benchmarks
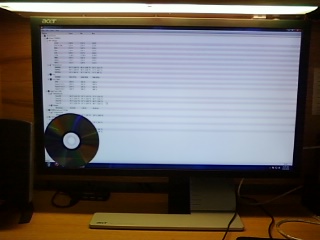
Passmark
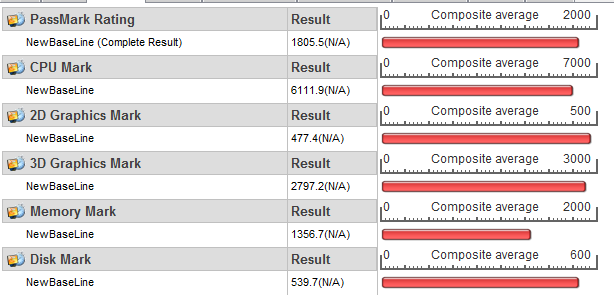
Passmark is a program used to benchmark components of your system. The great thing about this software is that you can upload the results to their site, that way they can create charts of common components so you can compare yours against other people. I was quite surprised how mine ranked compared to others since I did overclock many of the components. You can see the scores bewlowMy processor scored a 6111.9 which is equivelant to an Intel Core i7 940 @ 2.93GHz.
My Graphics Card scored a 2797.2 which is equivelant to a Radeon HD 6870
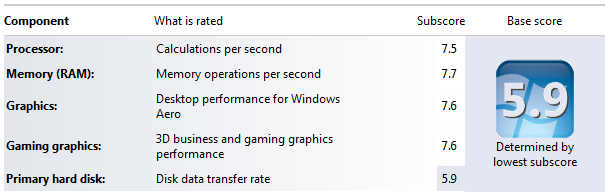
Windows Experience Index
Windows Experience Index is a benchmarking program included in Windows 7 which rates components from 0-7.8. I was also quite pleased with the results of this test when I ran it. The lowest score is the hard drive which is to be expected since it is only 7200rpm and solid state drives are the ones pulling in the 7+ ratings.